Archive for the ‘Reporting Services’ Category

Creating multiple dynamic charts based on a group of values can be easily done by a matrix in SSRS.  In that way it won’t be required to change design when new entries are added to the dataset. In addition to that, group value can be used to filter data in the chart. So using one dataset we can achieve this task.

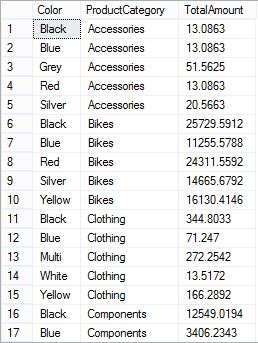
Here we have an example from AdventureWorks db. I have written a simple query to get all the items grouped by their color, quantity and related product category.

dataset

What we need to display using this data set ?

I need a separate column chart which will display total value by color, for each product category.

How we are going to achieve this ?

It needs to be dynamic charts which will change according to number of items in product category, therefore we cannot create multiple charts. So basic solution would be to create matrix and insert a chart inside data column.

Steps

First of all insert a matrix to the report and set ProductCategory as row group. Then add a chart inside the data column just like below figure.

insert_chart

Once chart is inserted, we need to set color and total value fields accordingly just as a basic column chart. Set the chart title as ProductCategory column.

draft

That’s pretty much all. But it’s better to hide first column in the matrix and format matrix border colors, so it won’t look like a table. Let’s see how it looks in the preview.

chart

Sometimes it is not easy to identify what is the exact axis unit suitable for a chart. Let’s assume a column chart with total amount in Y axis(Billions) and months in X axis. If we filter this chart by branch, those amounts will go down to millions. Sometimes the change can be significant compared to total amount. In this scenario we need to change the y axis unit accordingly, other wise users will be unable to get the correct picture.

Well, there is a labels format property when you select the axis. Following is an expression for that property.

=SWITCH(MAX(Fields!Total_Amount.Value)>1000000000,”0,,,.00;(0,,,.00)”, MAX(Fields!Total_Amount.Value)>1000000,”0,,.00;(0,,.00)”, MAX(Fields!Total_Amount.Value)>=0,”0,.00;(0,.00)”)
 

As you can see, I just divided measure column in to three categories. By billions, by millions and by thousands comparing maximum amount for the current data set.

Furthermore, this expression wont be enough. Because if we have axis label, then we need to change that as well. Below shows relevant axis label expression.

=SWITCH(MAX(Fields!Total_Amount.Value)>1000000000,”Rs.(Bn)”,MAX(Fields!Total_Amount.Value)>1000000,”Rs.(Mn)”,MAX(Fields!Total_Amount.Value)>=0,”Rs.(‘000)”)


This time I thought to write about Microsoft SQL Server 2012 new feature power view integration with SharePoint 2010/2013 . Yes with existing multidimensional cube. There are so many spikes here and there so I will try to explain as much as simple.

Following are the requirements for this environment.

  1. SQL Server 2012 SP1 Cumulative Update 4 or above (http://support.microsoft.com/kb/2833645)
  2. SharePoint Server 2010 or 2013
  • First of all you need to install SharePoint server.(2010 or 2013)
  • Then Install SQL Server 2012 to same server.
    • Install instance of SQL Server database engine with reporting services-SharePoint.

SQLServer_ReportingServices

    • then you need to install powerpivot instance for SharePoint. (Do not check on Add SQL Server Database option since you already have one)

SQLServer_PowerPivot

  • Create your site collection in SharePoint using powerpivot site template.
  • Run the PowrPivot configuration tool in order to configure power pivot in your SharePoint installation. If you installed SharePoint 2013 then run PowerPivot configuration for SharePoint 2013 Configuration.

PowerPivot_Configuration

  • After configuring powerpivot there will be power pivot solutions in SharePoint farm.
    • In SharePoint Central Administration go to System Settings
    • Manage farm solutions under Farm Management
    • Deploy powerpivot solutions to your site collection.

Farm_Solutions

  • Activate power pivot integration feature in your site collection. (Site Settings –> Site Collection Features under Site Collection Administration)

PowerPivot_Feature

  • Then install SharePoint reporting service and create service proxy.
    • Run following commands in SharePoint Management Shell with administrator privileges.
    • Install-SPRSService
    • Install-SPRSServiceProxy
  • Start reporting services service
    • In SharePoint Central Administration go to System Settings
    • Then start Reporting Services in Manage Services on Server
  • Create reporting services web application in SharePoint.
    • In SharePoint Central Administration go to Application Management
    • Then go to Manage Service Applications under Service Applications
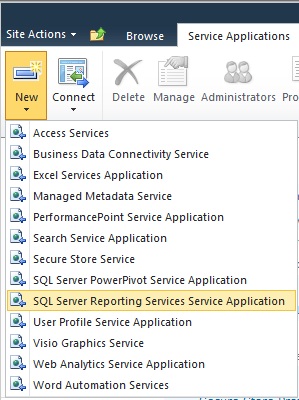
    • Create new SQL Server Reporting Services service application

ReportingServiceApplication

    • Create new application pool for this service application

CreateNewApplication

  • Create new power pivot site in your site collection

CreateNewSite

  • In that created site, you will have inbuilt power pivot gallery library. In that library, go to library settings.
  • In Advanced Settings, Enable content types.

AdvancedSettings

  • Now in library settings, you will have Add from existing site content types. Go to that link and add BI Semantic model and Report Data Source

AddContentTypes

  • After adding those content types you can create new Report Data Source in power pivot gallery.

NewReportDataSource

  • Following figure shows how to configure Report Data Source. Select Microsoft BI Semantic Model for Power View as Data Source Type. Give your analysis server as connection string.

DataSourceProperties

  • Now you have Report Data Source. That’s all you need to create your first power view report using your existing multidimensional cube. 🙂

PowerViewReport

Feel free to give any suggestions.

When we come to pagination of SSRS reports, its quite linked with performance. For  example, if you are trying to load huge report without pagination that’s going to be a mess. Because SSRS trying to load every record in a single page. But on the other hand , if you want to load simple report in one page where you don’t want to go to several pages then you can specify that using report properties.

This can be done easily with following way. (this explanation has been done using BIDS environment)

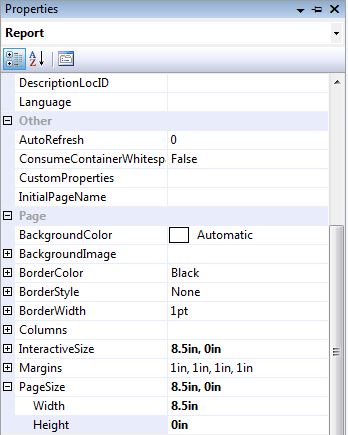
Once you click the page area of SSRS report, some properties will appear in properties window. What you have to do is change page width according to your purpose. If you set this to 0 inches then report will load in a single page. if you set this to some other value, report will load according to that value.

Page Properties

I published a post that explaining about Passing Parameters to SSRS Report using URL few months ago. That post solves one problem but still there are some other issues that need to be addressed. When we are going to pass a multiple value parameter there are some . The reason is we cannot pass 1-dimensional array through an URL.

When we  want to pass dynamically changing  multiple values to SSRS report through URL,  try the following way.

We have our original report and target report. Since SSRS does not allow to pass multi value parameter to our target report, I have to pass values as one string. What I’m going to do is pass all the values as string to temporary parameter in the target report and then split those values.

Scenario

We have a original report which has a parameter named Status and target report with a MonthlyStatus  parameter. Both these parameters are multi-value parameters. Basically I’m going to pass values from Status parameter to MonthlyStatus  parameter when user perform an action(drill down).

In Original Report

SSRS does not allow to pass multi-value parameters (as arrays) through URL. Therefore what I’m going to do is send it as one string. Join function can be used to pass the parameter values separated by commas as one string like following script shows. This needs to be set in URL field in the report series action dialog box. That’s the only thing we should do in our original report. Don’t bother about param1. For the time being use it as follows.

=”javascript:void(window.open(‘<ReportServerURL>?<ReportURL>&rs:Command=Render&param1=” & Replace(Join(Parameters!Status.Value,”,”),”&”,”%2526″)  & “,’_blank’))”

(Above code is clearly described in Passing Parameters to SSRS Report using URL)

In Target Report

Then we go to the target report. I have to set those values to MonthlyStatus  parameter in my target report. Before that we need to add new parameter for target report and I named it as ‘param1‘ ( I think now you can get the idea about param1 which I used in above expression. Instead of directly passing to MonthlyStatus use param1). param1 is a new parameter, which doesn’t have  any available values or any default values.  Set parma1 as a hidden parameter. no one needs to see that 🙂

Now we have all the values separated by commas in param1 and need to split each value and set to related parameter. We can do this by editing the default value expression of the targeted parameter (in this case MonthlyStatus)

Make sure param1 is placed above the MonthlyStatus  in the parameter order. Because MonthlyStatus  using param1 value as its default value.

Note: You cannot see the report preview in BIDS. But after deploying the report you can see that multi-value parameter’s values are passing to target report.

There may be some better solutions for this ! If so please suggest.

Freemarket.com Marketplace

Parameters are very useful when it’s come to report customization. It’s going to be more useful, if those parameters can be set before loading the report. You can do it easily using URL.

There are two ways to do this task.

1]   using Report Viewer (this is the default way when you configured reporting service to SharePoint Integrated mode)

2] using HTML viewer (This is the most interesting way in SharePoint Integrated mode. I’m going to explain this way)

1.

When you passing parameters to  report viewer you have to follow this way.

ReportViewerURL &rp:parameter1=Value1&rp:parameter2=value2

nothing is wrong with this except parameters will be displayed in right hand side pane, which I do not like 🙂

2.

You can use the HTML viewer to view the reports .

here is the way to view the report in HTML viewer.

Your Report Server Virtual Directory ? Full Path of Report (where report is deployed in SharePoint site)

Example — > http://Server1/ReportServer?http://server1/sites/Test/Reports/YearlyTrend.rdl

Using above example you can view the report in HTML viewer. When it comes to parameter passing  just append the parameter names and values to end of the URL with rs:command=render.

http://Server1/ReportServer?http://server1/sites/Test/Reports/YearlyTrend.rdl&rs:command=render&parameter1=Value1&parameter2=value2

You can pass multiple parameters using above format. Target report’s parameters will be affected by values that you passed in URL 🙂


Further Modifications …

This can be used in SSRS Report drill down. When you want to drill down a report there is an option to set URL.

Simply set the URL to target report using expression with available parameters. Following expression can be used to pop up the target report in separate window.

=”javascript:void(window.open(http://Server1/ReportServer?http://server1/sites/Test/Reports/YearlyTrend.rdl&amp;rs:command=render&parameter1=Value1&parameter2=value2‘,’_blank’))”

After all most common seen problem is ‘&’ (ampersand) symbol cannot pass in URL. It is essential in this scenario since most of the time parameter values contain ‘&’ symbol. See the following example.

=”javascript:void(window.open(‘http://Server1/ReportServer?http://server1/sites/Test/Reports/YearlyTrend.rdl&ReportParameter1=” & Parameters!ReportParameter1.value & ” ‘,’_blank’))”

Parameters!ReportParameter1.value contains a ‘&’ symbol but this cannot be passed. you can Replace the ‘&’ symbol with ‘%2526’ ( which is the url encoding of ‘&’)

=”javascript:void(window.open(http://Server1/ReportServer?http://server1/sites/Test/Reports/YearlyTrend.rdl&ReportParameter1=” & Replace(Parameters!ReportParameter1.value,”&”,”%2526″) & ” ‘,’_blank ‘))”

Post any problems related to this. Please suggest any improvements too.